
“I tried automatically generating Google Slides with Google Apps Script, but the inserted tables and images are all over the place and look messy…”
“I want to neatly align a spreadsheet chart and on-site photos of our Sapporo office side by side with pixel-perfect precision!”
The solution to these exact layout problems lies in PageElement.setLeft() and PageElement.setTop(), which we will explore today!
Throughout “Phase 7: Google Slides Automation” of this series, we have covered how to create new presentations and insert shapes, text, tables, and images.
However, simply inserting elements often results in them overlapping in the center or looking misaligned and unbalanced.
In this 74th tutorial, we’ll dive deep into how to programmatically control the exact X (horizontal) and Y (vertical) coordinates of any slide element (shapes, images, tables, text boxes, etc.) and arrange them into a beautiful two-column split layout in Google Apps Script!
Using a monthly report presentation for our Sapporo office as a real-world example, let’s master smart, formula-driven dynamic layout adjustments together!
1. What Are PageElement, setLeft(), and setTop()?
When automating Google Slides with GAS, the fundamental concept you first need to grasp is the “PageElement”.
What Is a PageElement?
A PageElement is the common parent class for every visual object placed on a slide.
- Shape
- Image
- Table
- TextBox
- SheetsChart (embedded chart)
All of these are types of PageElements. Because of this structure, you can universally adjust their positions (setLeft, setTop) and dimensions (setWidth, setHeight) regardless of the element type.
The Roles of setLeft() and setTop()
These methods move an element to a specific coordinate position on the slide canvas, measured in points (pt).
| Method | Pronunciation / Description | Role | Argument Value |
PageElement.setLeft(x) |
set-left | Sets the **horizontal position (X coordinate)** from the slide’s left edge | Number of points (number) |
PageElement.setTop(y) |
set-top | Sets the **vertical position (Y coordinate)** from the slide’s top edge | Number of points (number) |
The Slide Coordinate System (Where Is Origin 0, 0?)
In Google Slides, the coordinate origin (X = 0, Y = 0) is located at the top-left corner of the slide.
- Increasing the value of
setLeft()➡ Moves the element to the right - Increasing the value of
setTop()➡ Moves the element downwards
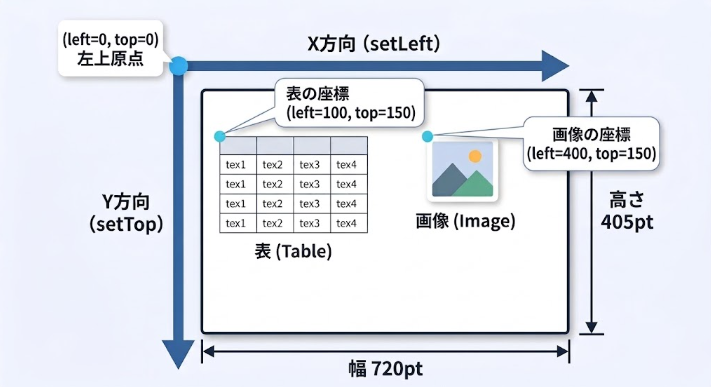
A standard 16:9 Google Slide has a canvas size of 720 pt width × 405 pt height. We use these total dimensions as the baseline to calculate our element layouts.
2. STEP 1: Preparation! Create the “Sapporo Office Monthly Performance Report”
First, let’s set up a test presentation so we can try out layout automation with GAS!
1. Create a New Google Slide Presentation
- Create a new “Google Slides” file in Google Drive.
- Name the presentation “Sapporo Office Monthly Performance Report”.
- Copy the Presentation ID from the URL in your browser’s address bar.
- URL format:
https://docs.google.com/presentation/d/【YOUR_ID_IS_HERE】/edit
- URL format:
2. Place a “Table” and an “Image” (or Shape) on the Slide
Either insert them manually or use the code learned in previous tutorials (such as #68 and #70) to place two elements on the first slide:
- Element 1: Monthly sales trend table for the Sapporo office (Table)
- Element 2: Store or workplace activity photo of the Sapporo office (Image)
* Their initial positions and sizes do not matter at all. Even if they are completely misaligned, GAS will organize them instantly!
3. STEP 2: [Hands-on] Align Image and Table Side-by-Side in a Two-Column Layout!
Now, let’s open the Apps Script editor and write some code.
In this example, we calculate the coordinates for our table and image so they sit neatly in a two-column layout (table on the left, image on the right) with a 30 pt gap between them!
1. Open the GAS Script Editor
- Open the GAS editor from Google Sheets (or create a standalone project).
- Copy and paste the following code into your editor:
function alignElementsSideBySide() {
  // 1. Open the presentation by ID (refer to tutorial #61)
  var presentationId = "YOUR_PRESENTATION_ID_HERE"; // * Replace with your actual Presentation ID
  var presentation = SlidesApp.openById(presentationId);

  // 2. Retrieve the first slide
  var slide = presentation.getSlides()[0];

  // 3. Get all page elements (PageElement) on the slide
  var elements = slide.getPageElements();

  // Verify that there are at least two elements
  if (elements.length < 2) {
    Logger.log("Error: At least two elements are required on the slide.");
    return;
  }

  // Define overall slide width and height (standard 16:9 = 720pt x 405pt)
  var slideWidth = 720;
  var slideHeight = 405;

  // Layout calculation parameters
  var marginX = 40;  // Left and right outer margin (pt)
  var marginY = 80;  // Top margin (height offset to avoid headers/titles)
  var gap = 30;      // Gap between left and right elements (pt)

  // Calculate width allocated to each side element
  // (Total Width - Left Margin - Right Margin - Center Gap) / 2
  var elementWidth = (slideWidth - (marginX * 2) - gap) / 2; // (720 - 80 - 30) / 2 = 305pt
  var elementHeight = 260; // Height

  // 4. Configure coordinates and resize the left element (1st element: table, etc.)
  var leftElement = elements[0];
  leftElement.setLeft(marginX);               // X coordinate: 40pt
  leftElement.setTop(marginY);                // Y coordinate: 80pt
  leftElement.setWidth(elementWidth);         // Width: 305pt
  leftElement.setHeight(elementHeight);       // Height: 260pt

  // 5. Configure coordinates and resize the right element (2nd element: image, etc.)
  var rightElement = elements[1];
  var rightX = marginX + elementWidth + gap;  // X coordinate: 40 + 305 + 30 = 375pt
  rightElement.setLeft(rightX);               // X coordinate: 375pt
  rightElement.setTop(marginY);               // Y coordinate: 80pt
  rightElement.setWidth(elementWidth);        // Width: 305pt
  rightElement.setHeight(elementHeight);      // Height: 260pt

  // 6. Output completion log
  Logger.log("Side-by-side alignment completed successfully!");
  Logger.log(" - Left Element X coordinate: " + leftElement.getLeft() + "pt");
  Logger.log(" - Right Element X coordinate: " + rightElement.getLeft() + "pt");
}
2. Execution Steps
- Replace
YOUR_PRESENTATION_ID_HEREwith the ID of your Google Slides presentation. - Click the “Save” icon, then click “Run”.
- Authorize access permissions when prompted on the initial run.
3. Verify Execution Results
Switch over to your Google Slides presentation tab to see the result!
The previously haphazard table and image are now resized to an identical width (305 pt), with their Y-axes (80 pt from top) snapped into place for a clean, balanced two-column presentation.
4. STEP 3: Practical Dynamic Layout Formula Patterns
When generating slide decks programmatically in practical projects, mastering dynamic coordinate formulas prevents your layout from breaking even when slide dimensions or element counts change.
Pattern 1: Top-and-Bottom Split (Vertical Stack Alignment)
Here is the formula pattern for stacking two elements vertically, such as key highlight cards or summary bullet boxes.
var marginY = 60;
var gapY = 20;
var availableHeight = 405 - (marginY * 2) - gapY; // Available height
var elementHeight = availableHeight / 2;          // Height per element

// First element (Top)
element1.setTop(marginY);
element1.setHeight(elementHeight);

// Second element (Bottom)
var top2 = marginY + elementHeight + gapY;
element2.setTop(top2);
element2.setHeight(elementHeight);
Pattern 2: Dynamic Loop Layout for 3-Column Card Designs
This loop automatically places three KPI summary cards horizontally for “Sapporo Sales, Engineering, and Customer Support”:
function alignThreeCards(slide) {
  var cards = slide.getPageElements(); // 3 card elements
  var totalWidth = 720;
  var marginX = 30;
  var gap = 20;
  var count = 3;

  // Dynamically calculate width per card: (720 - (30*2) - (20*2)) / 3 = 180pt
  var cardWidth = (totalWidth - (marginX * 2) - (gap * (count - 1))) / count;

  for (var i = 0; i < cards.length && i < count; i++) {
    var posX = marginX + i * (cardWidth + gap);
    cards[i].setLeft(posX);
    cards[i].setTop(100);
    cards[i].setWidth(cardWidth);
  }
}
5. 5 Common Pitfalls Beginners Face and How to Solve Them
Here are the top five pitfalls beginners encounter when using setLeft() and setTop(), along with their solutions.
Pitfall 1: Confusing PageElement with Specific Subtypes (Table, Shape, etc.)
Objects returned by slide.getPageElements() are generic PageElement instances.
While setLeft() and setTop() can be called directly on a generic PageElement, interacting with table cells or shape text requires explicit typecasting.
var elem = slide.getPageElements()[0];

// Repositioning works directly on PageElement!
elem.setLeft(50);

// Cast to Table if you need to manipulate table cells
if (elem.getPageElementType() === SlidesApp.PageElementType.TABLE) {
  var table = elem.asTable(); // Cast to Table type
  table.getCell(0, 0).setText("Sapporo Office");
}
Pitfall 2: Overflowing the Slide by Forgetting the Top-Left Anchor Point
A standard slide width is 720 pt.
If you call setLeft(600) on an element that has a width of 200pt, the total reaches 600 + 200 = 800pt, pushing the element past the right edge and out of the visible slide area!
- Rule: Always verify that
setLeft() + setWidth()does not exceed720.
Pitfall 3: Unexpected Behavior with Grouped Elements
When shapes and text boxes are grouped together on a slide, executing setLeft() on the Group PageElement moves the entire bounding container while preserving relative positions among child elements.
If you want to reposition individual elements inside a group, either ungroup them on the slide or access them via asGroup().getChildren() in your script.
Pitfall 4: Distorted Aspect Ratios When Resizing Images
Setting both setWidth() and setHeight() directly can distort original image proportions, stretching them horizontally or vertically.
To keep your graphics looking crisp, calculate and apply the original aspect ratio:
var img = element.asImage();
var origWidth = img.getWidth();
var origHeight = img.getHeight();
var ratio = origHeight / origWidth; // Calculate aspect ratio

var newWidth = 300;
img.setWidth(newWidth);
img.setHeight(newWidth * ratio); // Set height while maintaining aspect ratio
Pitfall 5: Unit Confusion Between getLeft(), setLeft(), and Display Pixels
Inside the Google Slides service in GAS, all coordinates and dimensions are consistently handled in points (pt).
Be careful not to mix points up with pixels (px) or inches.
- 1 inch = 72 points
- 1 point ≈ 1.33 pixels (in standard 96 DPI screen environments)
6. Summary and What’s Next
In this lesson, we mastered PageElement.setLeft() and setTop() to position and align Google Slides elements with point-level precision!
Key Takeaways
setLeft(x)sets the distance from the left edge, andsetTop(y)sets the distance from the top edge in points (pt).- The coordinate origin (0, 0) is always the slide’s top-left corner.
PageElementis the common parent class for shapes, images, and tables, allowing unified positioning methods across all element types.- Using dynamic formulas like
(Total Width - Margins) / Element Countensures elegant 2-column or 3-column layouts every time.
You can now generate beautifully structured, professional slide decks entirely through automated code!
Next up in Tutorial #75, we reach the grand finale of the “Google Slides Automation” phase!
We will learn how to convert generated presentations directly into PDF files and save or share them via Google Drive using Presentation.getAs('application/pdf').